What Are Marketing Analytics? A Simple Explainer
Struggling with what are marketing analytics? Our simple guide explains how they work, the metrics that matter, and how to use data to grow your business.
Let's be honest: the word "analytics" can sound a bit intimidating. When you ask what are marketing analytics, you might be picturing endless spreadsheets and complex formulas.
The reality? It's much simpler. It's about turning guesswork into confidence.
So, What Are Marketing Analytics, Really?
Think of marketing analytics as the GPS for your business. You wouldn't start a cross-country road trip without a map, right? You'd want to know if you were on the right highway, how much gas you had left, and if that shortcut was actually going to save you time.
In the same way, you shouldn't be spending money on marketing without a clear way to see if you're heading in the right direction. It’s not about drowning in data; it’s about finding the story hidden inside the numbers.
This whole process answers the critical questions that keep every marketer up at night:
- Which campaigns are actually bringing in customers?
- Where should I put my next marketing dollar for the best possible return?
- What messages are truly connecting with the people I want to reach?
- How can I walk into a meeting and prove that marketing is driving real business growth?
By measuring, managing, and analyzing your marketing performance, you get the actual insights you need to stop guessing and start making smarter moves.
The Core Components of Analytics
This isn't just about looking at a single number. It's a process that follows a clear path, turning raw data from your campaigns into decisions that actually move the needle.
The image below shows how it all works—taking all the information floating around from your campaigns, processing it, and turning it into smart choices that fuel your strategy.
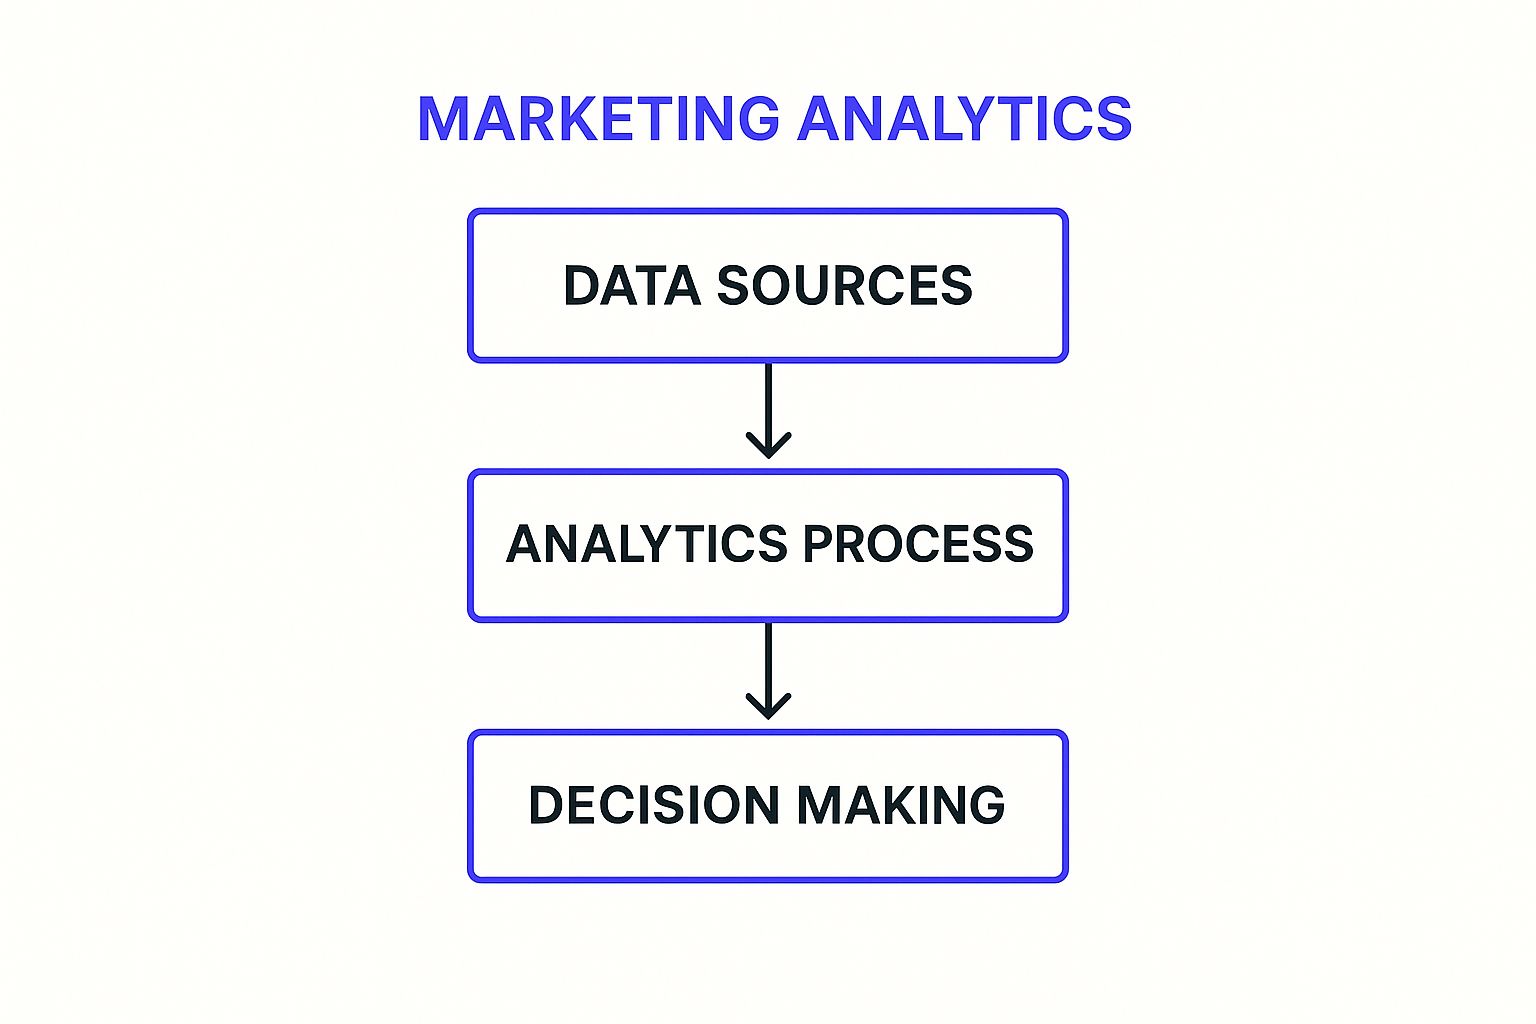
As you can see, it all starts with collecting information from different places. From there, it's about making sense of it all so you can make informed decisions instead of just reacting.
A Quick Breakdown of Analytics Types
To really get a grip on this, it helps to know that marketing analytics can be broken down into four core types. Each one answers a different kind of question, and together, they build a complete picture of your performance.
The only real failure in marketing is not learning from your efforts. Effective analytics ensures every campaign—successful or not—provides valuable lessons that make your next move smarter.
Here's a quick look at the four types. We'll dive much deeper into each one, but this table gives you a great starting point for understanding the key differences.
The Four Types Of Marketing Analytics
| Type of Analytics | What It Tells You | Example |
|---|---|---|
| Descriptive | "What happened?" | Your website traffic increased by 20% last month. |
| Diagnostic | "Why did it happen?" | That traffic spike came from a social media post that went viral. |
| Predictive | "What will happen next?" | Based on current trends, that post could drive 500 new leads this quarter. |
| Prescriptive | "What should I do?" | We should create more content similar to that viral post to maximize lead generation. |
See how each type builds on the last? You start with what happened, figure out why, predict what could happen next, and finally, decide what you should do about it. That's the whole journey from data to decision in a nutshell.
Why Marketing Analytics Is a Game-Changer
Ever feel like you’re just throwing money at your marketing and hoping something sticks? You launch a campaign, cross your fingers, and pray for the best.
Marketing analytics takes that guesswork and throws it out the window. It replaces hunches with hard data, turning your marketing spend from a blind gamble into a calculated investment that actually grows your business.
Instead of just wondering if your efforts are paying off, you’ll know. It's a fundamental shift, and it's why the global marketing analytics market, recently valued at around $5.35 billion, is on track to more than double in the next few years. You can dig into the specifics of this marketing analytics market growth on The Business Research Company.
From Cost Center to Revenue Driver
For far too long, marketing has been seen as a "cost center"—a necessary expense with no provable return. A black hole for the company budget.
Analytics completely shatters that old-school perception.
When you can draw a straight line from every dollar spent on a Facebook ad to the actual revenue it generated, your department stops being a cost. It becomes a predictable, powerful revenue engine for the entire company. This isn't just about feeling good about your campaigns; it's about earning a seat at the table where the real business decisions get made.
You can walk into any meeting and confidently say, "We invested X, and it brought back Y."
Marketing without data is like driving with your eyes closed. You might get somewhere eventually, but you’ll probably crash first. Analytics is the windshield that gives you a clear view of the road ahead.
This clarity is how you prove your team's value and secure the budget you need to make an even bigger impact. It’s the ultimate tool for demonstrating Return on Investment (ROI).
Gain a Serious Competitive Edge
In today's crowded market, the businesses that win are the ones that understand their customers best. Full stop.
Marketing analytics hands you an almost unfair advantage by giving you a detailed map of your customer’s entire world. You start seeing things your competitors are completely blind to.

Suddenly, you can uncover powerful insights like:
- Which channels bring in your best customers? Maybe Instagram drives a ton of traffic, but you discover that customers from your email list spend twice as much over their lifetime.
- Where are the silent killers in your sales funnel? You might find out a confusing checkout page is causing 40% of potential buyers to abandon their carts. Fixing that one page could instantly boost sales.
- What content actually works? By seeing which blog posts or videos lead to real conversions, you can double down on what resonates and stop wasting time on content that falls flat.
Armed with this level of detail, you can fine-tune every touchpoint, personalize customer experiences, and build much stronger relationships. You’re no longer just shouting into the void; you're having a real conversation with the people who matter most to your business.
The Core Metrics You Absolutely Need to Track
Drowning in data is a real risk. With countless numbers at your fingertips, it’s easy to get lost chasing vanity metrics—like social media "likes"—instead of tracking what actually drives sales.
The secret to smart marketing analytics isn’t measuring everything. It’s measuring the right things.
Think of it like the instrument panel in a cockpit. A pilot doesn't need to see every single sensor reading in the engine. They just need the critical information required to fly straight and land safely. Your marketing dashboard should do the same.
Let's build that dashboard.
Essential Marketing Metrics And What They Mean
To cut through the noise, you need a focused set of Key Performance Indicators (KPIs) that tell the true story of your marketing health. Here are the non-negotiables.
| Metric | What It Measures | Why It Matters |
|---|---|---|
| Conversion Rate | The percentage of visitors who take a specific, desired action (e.g., buy a product, fill out a form). | This is the ultimate bottom line. It tells you if your messaging, design, and offer are actually working. |
| Bounce Rate | The percentage of visitors who land on a page and leave without clicking anything else. | A high bounce rate is a red flag. It can mean your content isn't what they expected or your page is confusing. |
| Time on Page | The average amount of time visitors spend on a specific page. | Longer times suggest your content is engaging and valuable, which is a strong precursor to conversion. |
| Customer Acquisition Cost (CAC) | The total cost of sales and marketing to acquire one new customer. | This tells you exactly how much you have to spend to get a new buyer. It's the "cost" side of your growth equation. |
| Customer Lifetime Value (CLV) | The total predicted revenue one customer will generate throughout their entire relationship with your business. | CLV shows the long-term worth of a customer. It helps you decide how much you can afford to spend on CAC. |
| Return on Ad Spend (ROAS) | The amount of revenue generated for every dollar spent on advertising. | This is the ultimate measure of ad profitability. A high ROAS means your campaigns are printing money. |
| Click-Through Rate (CTR) | The percentage of people who saw your ad or link and actually clicked on it. | CTR measures how compelling your ad creative and copy are. It tells you if you're grabbing attention. |
By focusing on this core set, you move from guessing to knowing. You get a clear, actionable view of what’s driving real growth.
A Deeper Look at the Metrics That Matter
Website And Content Performance
Your website is your digital storefront. These metrics tell you how people are behaving once they walk through the door.
- Conversion Rate: This is the big one. It's the percentage of visitors who do what you want them to do, whether that’s buying a product or signing up for a newsletter. A high conversion rate means your messaging is hitting the mark.
- Bounce Rate: This is the digital equivalent of someone walking into your store, taking one look around, and immediately leaving. A high bounce rate can signal a disconnect between your ads and your landing page.
- Time on Page: How long are people sticking around? If they’re spending several minutes on a blog post, it’s a great sign your content is valuable. If they leave after 10 seconds, you have a problem.
These three work together. A low bounce rate and a high time on page are strong indicators of quality content, which is something we explore in our guide on how to measure content performance. This kind of engagement often leads directly to conversions.
Customer-Centric Metrics
While site metrics tell you what's happening right now, customer metrics zoom out to show you the long-term health of your business.
Smart marketing isn't just about getting a customer; it's about getting the right customer and keeping them. Customer metrics tell you if you're succeeding.
Here are the two you absolutely must know:
- Customer Acquisition Cost (CAC): Simply put, how much does it cost you to get one new paying customer? You calculate this by dividing your total marketing and sales spend by the number of new customers you gained in a period.
- Customer Lifetime Value (CLV): This number predicts the total profit you'll make from any given customer over time. A high CLV means you're not just making one-off sales; you're building profitable, long-term relationships.
The magic happens when you look at these two together. For a business to be sustainable, your CLV must be significantly higher than your CAC. If it costs you $100 to acquire a customer who only ever spends $50, you're on a fast track to going out of business.
Campaign Performance Metrics
Finally, you need to know if your specific marketing efforts are actually working. These metrics tie your ad spend directly to business outcomes.
- Return on Ad Spend (ROAS): For every dollar you put into an ad campaign, how many dollars do you get back? This is a simple, powerful way to measure the direct profitability of your paid ads.
- Click-Through Rate (CTR): This measures how many people saw your ad and were compelled enough to click it. A high CTR means your creative, copy, and targeting are resonating with your audience.
By focusing on this curated set of metrics, you can build a dashboard that gives you clarity, not confusion. You’ll know exactly what’s working, what isn't, and where to invest your time and money for maximum impact.
How Marketing Analytics Works in the Real World
Theory is great, but let's get down to brass tacks. How does all this data-crunching actually play out for a real business? It’s about solving frustrating problems and uncovering opportunities you didn't even know existed.
Imagine you run an e-commerce store selling handmade leather goods. You're getting decent traffic to your site, but sales are flat. This is where marketing analytics becomes your detective.
A quick look at a dashboard might show you exactly where customers are dropping off. You see that people add items to their cart, but a shocking 75% of them leave right at the shipping information page. That’s the "why."
Armed with this insight, you realize your shipping costs are a surprise—and they’re way too high. You decide to test a flat-rate shipping fee and display it prominently on your product pages. The result? Your cart abandonment rate plummets, and sales climb by 20% in a month. That’s the power of analytics in action.
Personalizing the Customer Journey
Let's switch gears to a software company. They have a fantastic product but struggle to keep new users engaged after they sign up for a free trial. Their generic, one-size-fits-all email sequence just isn't cutting it.
So, they turn to their analytics. By tracking user behavior within their app, they can segment new users into three distinct groups:
- Power Users: People who have already used advanced features.
- Casual Explorers: Those who have logged in but only touched the basics.
- Inactive Users: Sign-ups who haven't done much at all.
Now, they can send different emails to each group. Power Users get tips on advanced workflows, Casual Explorers receive tutorials on core features, and Inactive Users get a friendly check-in with a compelling case study.
Analytics lets you stop shouting the same message at everyone and start having personalized conversations at scale. It’s the difference between a megaphone and a friendly, helpful whisper.
This targeted approach leads to a massive boost in trial-to-paid conversions. The company isn't just sending emails; they're delivering the right message to the right person at the perfect time, all because they listened to what their data was telling them.
This kind of strategic importance is why the U.S. marketing analytics market, valued at $4.58 billion recently, is expected to more than double in the next six years. You can find more data about this growth in the United States marketing analytics market report.
These aren't just hypotheticals. This is what marketing analytics is all about—turning raw data into smarter decisions and real, measurable growth.
Your First Steps with Marketing Analytics
Ready to dive in? Getting started with marketing analytics isn't about climbing a mountain. It’s about taking a few smart, simple steps that build on each other. You don’t need a huge budget or a data science degree to start making better decisions today.
The secret is to start small and prove the value. Forget trying to track dozens of metrics right out of the gate. That's a recipe for overwhelm. Instead, we'll build a simple, actionable plan that delivers clarity from day one.
Set Clear, Actionable Goals
Before you look at a single piece of data, you have to know what you're trying to accomplish. Without a clear destination, your data is just noise. Your goal is the filter you'll use to make sense of everything else.
Don't just say, "I want more traffic." That's a wish, not a goal.
A real goal sounds like this: "I want to increase qualified leads from our blog by 15% in the next quarter."
See the difference? This specific goal immediately tells you what to measure:
- Lead source: Are the new leads actually coming from the blog?
- Conversion rate: Which specific blog posts are turning readers into leads?
- Lead quality: Are these the right kinds of leads for our business?
By defining what winning looks like first, you give your data a job to do.
Choose the Right Tools for Your Budget
You absolutely do not need to spend a fortune to get started. In fact, some of the most powerful tools out there are completely free.
- For $0: Google Analytics is non-negotiable. It’s the starting line. It gives you an incredible amount of insight into who visits your site, how they behave, and what makes them convert. Combine it with the free, built-in analytics from your social media platforms (like Meta Business Suite or LinkedIn Analytics), and you have a powerhouse foundation.
- For growing businesses: Once you start scaling, you might explore platforms like HubSpot or Semrush. These tools start pulling data together from different channels, giving you a much clearer picture of the entire customer journey.
The right tool is simply the one that answers your most important questions without breaking the bank. Start free, show that it works, and then invest in more advanced options as you grow.
Build Your First Simple Report
Your first report should not be a 50-page snoozefest. It should be a single page—a dashboard that answers your biggest questions in a glance. Using a free tool like Google Looker Studio, you can pull data from Google Analytics and create a simple, visual summary.
The goal of your first report isn't perfection; it's clarity. It should transform confusing data into a simple story that tells you whether you're winning or losing, and why.
For example, your first dashboard could track just three things: website traffic by source, the conversion rate on your main landing page, and your Customer Acquisition Cost (CAC). This focused view is infinitely more valuable than a mountain of data you never look at.
Don't feel bad if this feels like a challenge. Industry predictions show that nearly 87% of marketers feel data is their most under-utilized asset. And for good reason—without a clear plan, it's just numbers. You can learn more about how marketers are planning to use data in the coming years.
Starting with marketing analytics is a journey, not a sprint. Set a clear goal, pick the right tool for right now, and build a simple report that gives you clarity. Once you master this, you can apply the same thinking to other assets. For instance, check out our guide on effective PDF marketing strategies to see how data can transform even a simple document.
Common Marketing Analytics Questions
As you start wading into the world of data, it’s totally normal for a few questions to pop up. Let's tackle some of the big ones that always come up when people first get their hands dirty with marketing analytics. My goal here is to give you straight answers so you can move forward feeling confident.
Think of it like this: you've got your destination (your goals) and your GPS (your tools). This is just a final check to make sure you’re ready for the drive.
What's the Difference Between Marketing Analytics and Web Analytics?
Great question. This one trips a lot of people up.
The easiest way to think about it is that web analytics is just one piece of the much larger marketing analytics puzzle.
Web analytics, which is what a tool like Google Analytics does, is laser-focused on what happens on your website. It answers questions like:
- Who's visiting our site?
- Which pages do they love the most?
- How quickly do they leave?
Marketing analytics, on the other hand, zooms out. It connects your website data with everything else you're doing—your email campaigns, social media ads, SEO work, and even offline events. It's the whole picture.
So, while web analytics tells you that traffic from Facebook went up, marketing analytics helps you see if that specific traffic actually led to sales and what the real ROI on that ad spend was. One is about your website; the other is about your entire marketing engine.
Do I Need to Be a Data Scientist to Use Marketing Analytics?
Absolutely not. While data scientists do incredibly complex work, modern analytics tools are built for the rest of us. Platforms like Google Analytics, HubSpot, and the dashboards inside your social media accounts are all designed to show you data in a way that’s easy to digest.
The most important skill you need isn't advanced math; it's curiosity. It’s about learning to ask the right questions and looking for the story your data is trying to tell you.
You don't need to be a statistician to ask simple, powerful questions like, "Which blog posts are bringing in the most leads?" or "Where are our best customers actually coming from?" As your needs get more complex, you might bring in specialized help, but anyone can—and should—start using basic analytics to make smarter decisions today.
How Much Does It Cost to Get Started?
This is the best part. The cost can be anything from completely free to thousands of dollars a month, which means there's a starting point for every budget.
You can start for $0 with incredibly powerful tools. Google Analytics is free for your website, and the built-in analytics on platforms like Facebook and LinkedIn don't cost a dime.
The key is to start small, prove the value, and then scale. Once your analytics help you optimize a campaign and generate more revenue, you can reinvest a piece of that into more advanced tools. It's a process that grows right alongside your business. For instance, you could start by analyzing document engagement before buying a broader software suite. We actually explain more about why smart marketers are ditching download gates for custom viewers—a strategy proven by this kind of focused analytics.
Ready to transform your static documents into powerful lead-generation tools? With OwlDock, you can track exactly how your audience engages with your content, add smart CTAs, and see real results. Stop guessing and start knowing. Start your free trial with OwlDock today and see what your data can do for you.